
Frontend performance problems in Angular applications are predictable and fixable. We audit your application's change detection strategy, bundle composition, render performance, and Core Web Vitals — then implement the fixes with measurable before-and-after results.
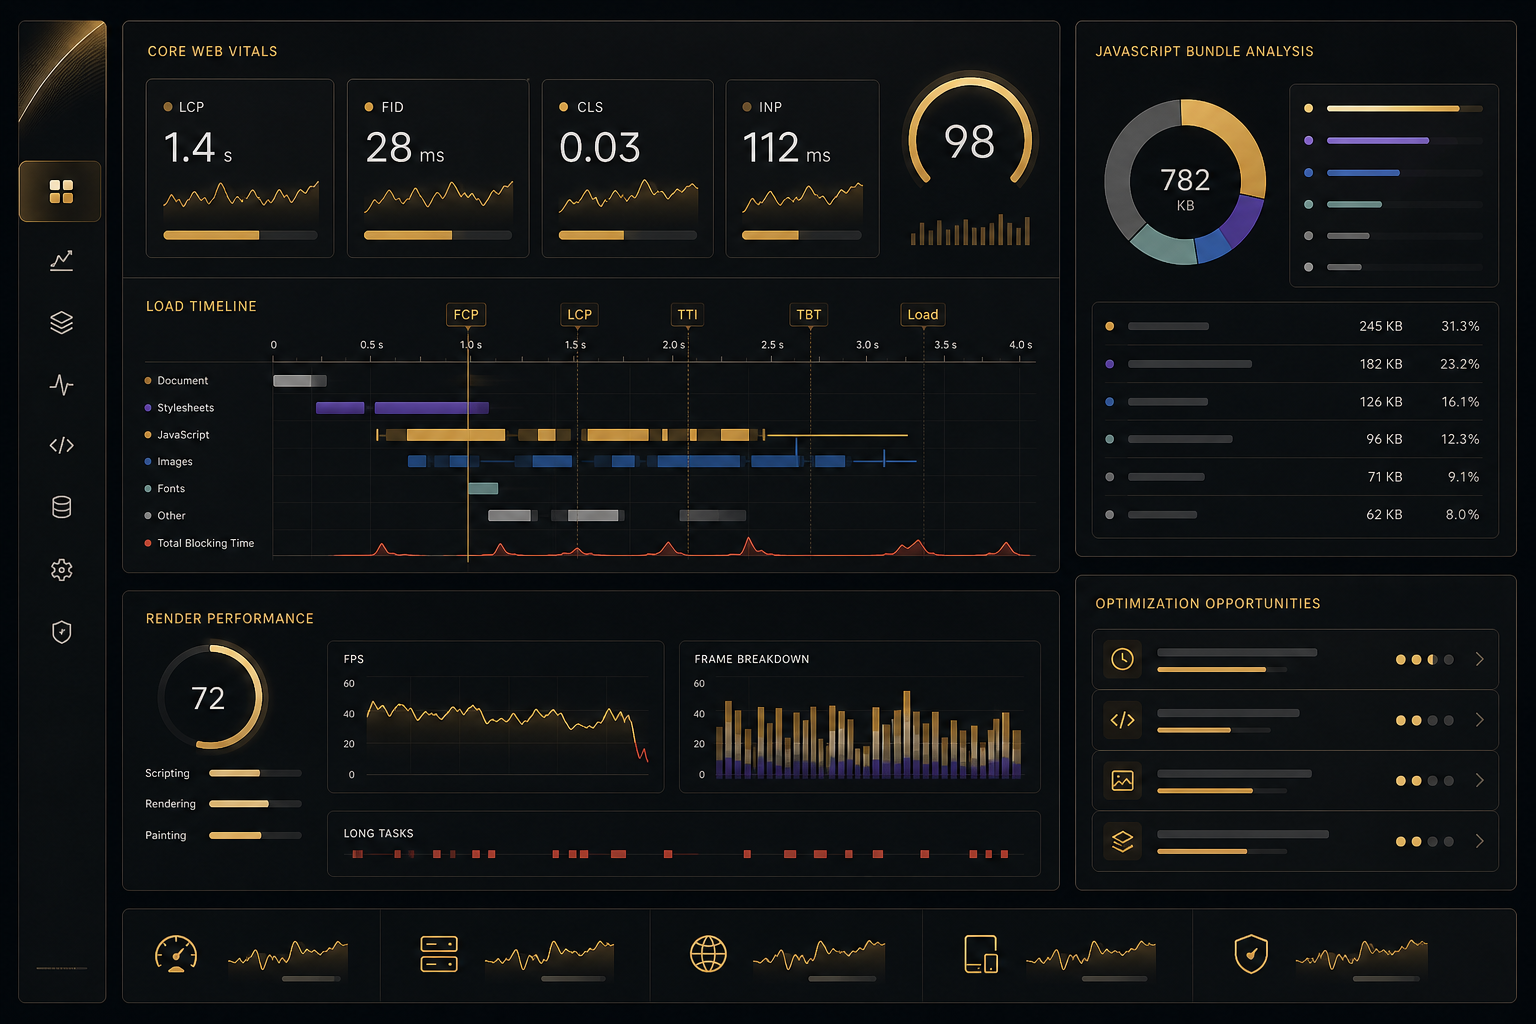
Frontend performance problems in production Angular applications follow a set of predictable patterns. They are not random — they are the cumulative result of specific architectural decisions made under time pressure, often by developers who were not aware of the performance implications at the time. Because these patterns are predictable, they are also fixable systematically. A performance audit is not a creative exercise; it is a diagnostic process with known investigation paths and known remediation techniques.
The most pervasive cause of Angular performance degradation is the Default change detection strategy. Angular's Default strategy checks every component in the tree for changes on every browser event, every timer tick, and every resolved promise. On a simple application with 20 components, this is unnoticeable. On a production enterprise application with 150 components, live data feeds, and frequent user interaction, Default strategy generates thousands of unnecessary component checks per second. The CPU impact is real and measurable: running the Angular DevTools profiler on an application with Default strategy will typically show 30–50% of CPU time spent in change detection for components that have not changed.
Large initial bundle sizes are the second common cause of poor performance. A 2MB JavaScript bundle requires approximately 6–8 seconds to parse and evaluate on a mid-range mobile device, even after transmission. Yet most Angular applications we encounter are shipping significant portions of their application in the initial bundle — feature modules that are only relevant to a subset of users, large third-party libraries loaded synchronously, and duplicated dependencies that result from misconfigured shared module imports. The fix is almost always available: proper lazy loading with loadChildren, route-level preload strategies, and deferred imports can reduce initial bundle sizes by 40–60% without any change to application behaviour.
Synchronous data transformations in templates are a third common pattern. Template expressions like {{ items | sort | filter }} using impure pipes, or complex calculations performed inline in template bindings, execute on every change detection cycle. Moving these transformations to memoised NgRx selectors or pure pipes means they execute only when their inputs change — a significant difference when change detection runs hundreds of times per second. Memory leaks from unsubscribed RxJS observables accumulate over user sessions, causing progressive degradation that users experience as the application slowing down over time without a page reload.
Third-party scripts are often overlooked as performance contributors. A single analytics SDK, chat widget, or advertising script loaded synchronously in the document head can add 200–400ms to Time to Interactive. The fix is straightforward — defer loading non-critical scripts — but identifying which scripts are responsible requires measurement tools, not guesswork.
We approach performance audits as an engineering problem, not a checklist exercise. Every finding is backed by measurement data, and every recommendation is prioritised by impact relative to implementation cost.
Before we touch a line of code, we establish a comprehensive measurement baseline. This baseline is what we compare against after remediation to quantify the actual improvement — without it, performance work produces anecdotal impressions rather than accountable results. Our baseline toolkit includes: Lighthouse run under controlled laboratory conditions for repeatable Core Web Vitals scores; WebPageTest for multi-location, multi-device real-world measurements; the User Timing API for application-specific markers (time to first data render, time to first meaningful interaction); Chrome DevTools Performance panel recordings of specific user flows; source-map-explorer for bundle composition analysis; and webpack-bundle-analyzer for visual identification of oversized dependencies and duplicate packages.
The baseline phase typically takes one to two days and produces a prioritised list of performance bottlenecks ranked by estimated impact. This prioritisation is critical — not all performance work delivers equal return on engineering investment, and we want to ensure that the highest-impact changes are implemented first.
Angular's change detection system is powerful and flexible, but it requires deliberate configuration to perform well at scale. Our change detection audit systematically examines every component in the application for change detection strategy assignment, identifies impure pipes and their invocation frequency, maps non-stable object and array inputs that cause reference changes without semantic changes, and quantifies the change detection frequency per component using Angular DevTools profiler recordings.
The output of this phase is a per-component remediation specification: which components should be migrated to OnPush, which input bindings need to be stabilised, which pipes need to be converted from impure to pure, and which template expressions need to be moved into memoised selectors. We prioritise by the number of change detection cycles each fix will eliminate rather than by component count, ensuring the highest-frequency components are addressed first.
Bundle analysis reveals the composition of your JavaScript delivery and identifies opportunities for dramatic size reduction. We examine tree-shaking effectiveness — large utility libraries like Lodash or Moment.js that are imported as whole packages instead of individual functions are common culprits, each adding hundreds of kilobytes to the bundle unnecessarily. We identify duplicate packages, which occur when multiple dependencies specify different version ranges for the same library and the bundler cannot deduplicate them. We map the granularity of lazy loading, identifying feature areas that should be independently lazy-loaded but are currently included in the initial bundle.
Synchronous imports in constructors and module initialisation code are a specific pattern we look for, because they prevent the bundler from code-splitting at natural lazy load boundaries. Moving these to async imports or lazy DI tokens often unlocks significant lazy loading opportunities that are otherwise blocked.
The Chrome DevTools Performance panel provides microsecond-level visibility into the browser's rendering pipeline. We record performance traces of the application's most performance-sensitive user flows and analyse the flame chart for long tasks — any JavaScript execution block longer than 50ms that blocks the main thread and prevents the browser from responding to user input. Long tasks are the root cause of poor Interaction to Next Paint scores and the "unresponsive" feeling that users describe in busy enterprise dashboards.
Layout thrashing — alternating between DOM reads and writes that force repeated layout recalculations — is a common cause of visual jank in data-rich interfaces. We identify these patterns and restructure DOM manipulation sequences to batch reads and writes separately. CSS animation performance is evaluated for use of compositor-only properties (transform and opacity) versus properties that trigger layout recalculation (width, height, top, left). Memory profiles are analysed for heap growth patterns that indicate observable subscription leaks and closure-retained object trees that prevent garbage collection.
Google's Core Web Vitals are the primary signals by which your application's user experience is quantified and compared. For enterprise SaaS products and B2B applications, Core Web Vitals scores directly influence organic search visibility, but more importantly, they are a proxy for the actual quality of experience your users receive every day.
LCP measures the time from navigation start to the point at which the largest content element visible in the viewport has been rendered. Good LCP is below 2.5 seconds. For Angular applications, LCP is typically delayed by large initial JavaScript bundles that must be downloaded, parsed, and executed before the framework can render anything. Our interventions include preloading critical resources with <link rel="preload">, deferring non-critical scripts, implementing Angular Universal for server-side rendering of the initial HTML payload, and optimising the critical rendering path to minimise render-blocking resources.
INP replaced First Input Delay as a Core Web Vital in 2024 and measures the latency of all interactions throughout the page lifecycle, not just the first one. Good INP is below 200 milliseconds. INP is where Angular's change detection overhead most directly manifests as a user-perceivable problem. When a user clicks a button and the browser must spend 80ms in Angular change detection before it can update the UI, that interaction feels sluggish. Our INP optimisation work focuses on identifying and eliminating synchronous work over 50ms in event handlers, migrating change detection to OnPush, and deferring non-essential update processing until after the visual response has been rendered.
CLS measures unexpected layout shifts during page load and interaction. Poor CLS scores are typically caused by images and media without explicit dimensions, dynamically injected content that displaces existing content, and web fonts that load after the initial text render and cause reflow. We audit every dynamic content insertion point in the application, implement skeleton loaders that reserve space before data arrives, add explicit dimensions to all media elements, and implement font loading strategies that minimise the flash of unstyled text.
Is your Angular application slower than it should be? We'll identify every bottleneck — change detection, bundles, render — and give you a prioritised fix plan.
Request AuditRelated Services
Per-component change detection strategy analysis with Angular DevTools profiling, impure pipe identification, input stability analysis, and a complete OnPush migration specification.
source-map-explorer analysis, duplicate dependency detection, lazy module granularity mapping, tree-shaking audit, and implementation of route-level code splitting.
Identification of data lists and tables rendering all rows to the DOM, virtualisation strategy selection, and CDK Virtual Scroll implementation for high-row-count views.
Lighthouse and CrUX data analysis, LCP/INP/CLS root cause identification, and a prioritised remediation plan with expected score improvement for each intervention.
Chrome DevTools memory profiling, heap snapshot comparison across navigation cycles, identification of unsubscribed observables and retained DOM references, and fix implementation.
Bundle size budgets enforced in CI, performance budget configuration in angular.json, Lighthouse CI integration, and automated performance regression alerts on pull requests.
A comprehensive audit of a medium-complexity Angular application (50–200 components) typically takes 3–5 days. This covers the full methodology: measurement baseline establishment, change detection audit, bundle analysis, render performance profiling, and Core Web Vitals triage. The output is a written audit report with quantified findings, impact estimates for each remediation item, and a prioritised implementation roadmap. If you need implementation of the fixes in addition to the audit, the timeline extends based on the complexity of the remediation work — we can provide a fixed-scope implementation estimate once the audit findings are complete.
We offer both. Some clients prefer a pure audit engagement where we deliver the report and their internal team implements the fixes — this works well when you have experienced Angular engineers who want an expert second opinion and a prioritised fix specification. Other clients want us to implement the remediations directly, which ensures that the fixes are applied correctly and consistently across the entire codebase. For implementation engagements, we work in your repository, submit changes via pull requests for your team's review, and provide detailed commit messages explaining the rationale for each change. All implementations are accompanied by before-and-after measurement comparisons demonstrating the impact.
This depends on where you are starting from and which problems are present in your application. For applications with Default change detection and large initial bundles, Lighthouse performance score improvements of 20–40 points are typical. For applications that are already partially optimised, improvements are more targeted and often felt in interaction latency and real user experience rather than Lighthouse score alone. We do not make specific score guarantees before seeing the application, because the right number depends entirely on the baseline audit findings. What we commit to is delivering the highest achievable score given your application's architecture and constraints, with a clear audit report showing what was measured and what was changed.
Source code access is required for the change detection audit and bundle analysis phases. Without source code, we can only measure the symptoms — we cannot identify the specific components, modules, and imports that are causing them. We are comfortable with NDA requirements and work within standard enterprise security processes, including read-only repository access with no production environment permissions. For highly regulated environments, we can structure the engagement so that we provide the diagnostic tools and methodology and your internal team runs the analysis under our guidance, sharing only the results rather than the source code directly.
CI performance gates are the answer. We configure Angular's built-in bundle size budgets in angular.json so that any pull request that increases the initial or lazy chunk bundle sizes beyond defined thresholds fails the CI build. We integrate Lighthouse CI into your pipeline to run automated Lighthouse tests against pull request preview deployments and flag any Core Web Vitals regressions. For change detection regressions, we configure ESLint rules that flag the use of Default change detection strategy and impure pipes, making them visible at the code review stage. The goal is that the discipline of the initial optimization work is embedded into your development process, not lost over time as the team evolves.
Describe your performance issues and we'll tell you exactly what we'd look at first — before any formal engagement begins.