
We design and engineer production-grade enterprise dashboards that handle real-time data feeds, virtualised grid rendering, role-based access control, and complex KPI visualisations — without trading performance for density.
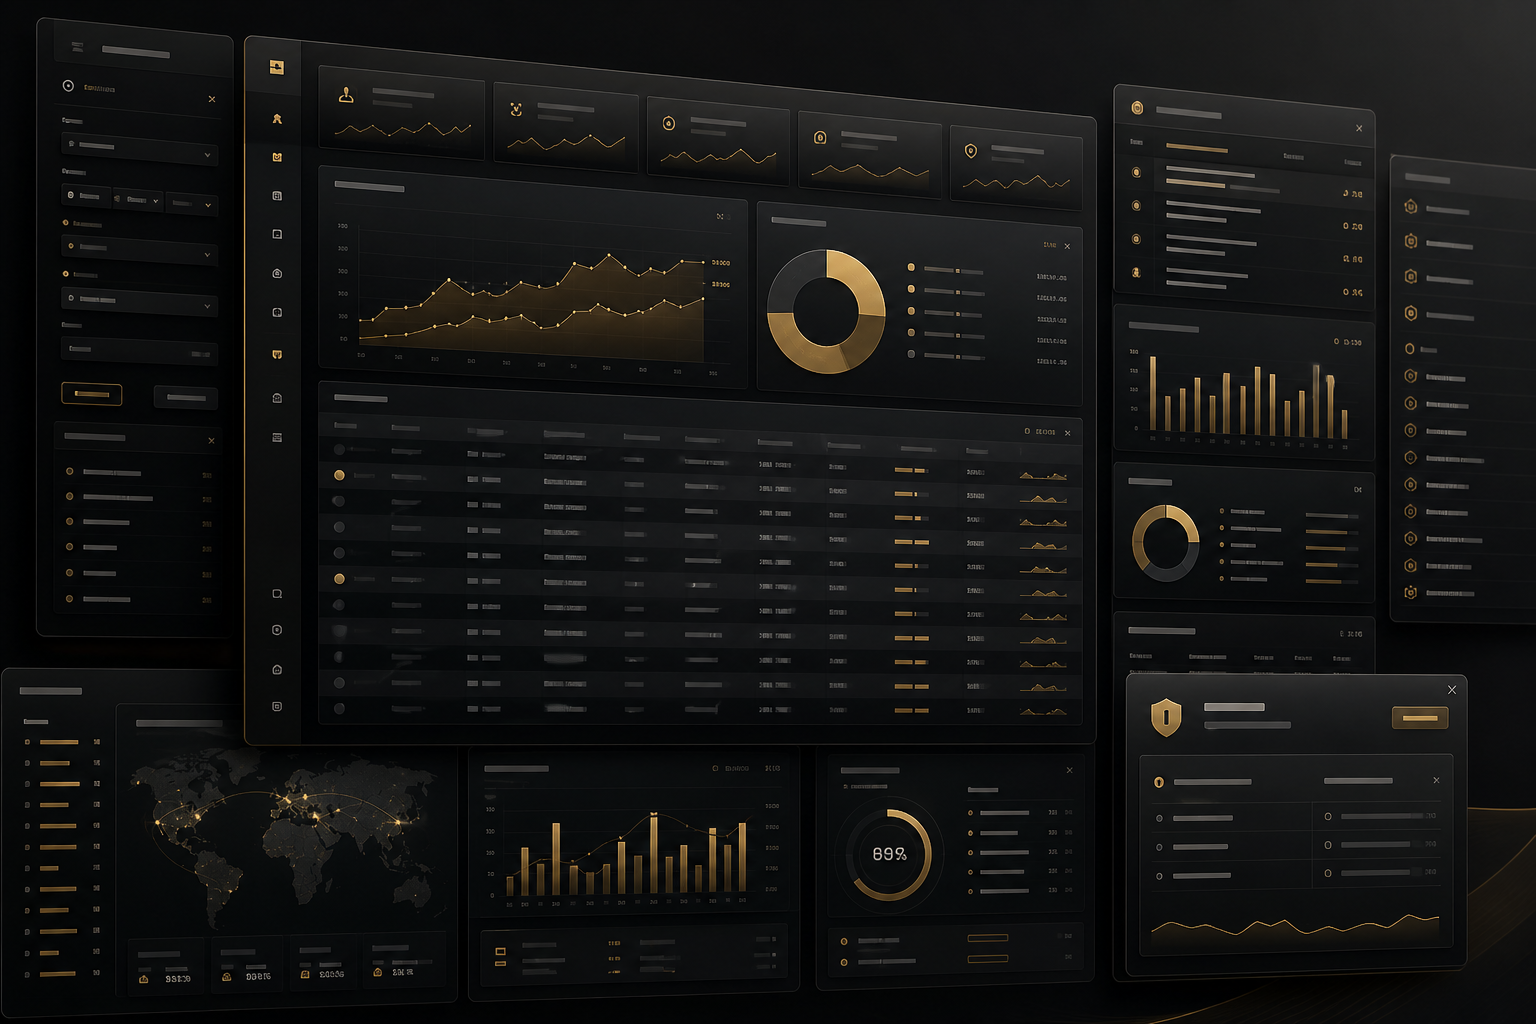
Enterprise dashboards fail in production for a set of highly predictable reasons — and almost all of them stem from teams applying consumer web development thinking to an environment that demands something entirely different. When a dashboard needs to display 500 rows of data updating every 200 milliseconds from a WebSocket feed, the engineering decisions made at the architectural level determine whether that product is usable or not.
The most common failure pattern we encounter is Angular's Default change detection strategy left in place across the entire component tree. With Default strategy, every browser event — a mouse movement, a focus change, a timer tick — triggers a full traversal of the component tree to check for changes. On a dashboard with 40 components rendering live data, this means thousands of unnecessary change detection cycles per second. The result is a UI that progressively degrades: first interactions feel sluggish, then the browser tab consumes a full CPU core, and eventually users begin refreshing the page to restore responsiveness.
The second failure mode is rendering without virtualisation. Loading 10,000 rows of data into the DOM simultaneously does not just feel slow — it is architecturally broken. The browser must calculate layout for every row, even those that are invisible. Scroll performance collapses. Memory consumption climbs. Teams respond by adding server-side pagination, which removes the power of the live data view entirely. The engineering problem was solvable; it just required virtualised rendering from the beginning.
WebSocket management is the third common point of collapse. Many implementations open a WebSocket connection in a component's ngOnInit, subscribe to it, and never properly close it. When users navigate away, the subscription persists. When connectivity drops and reconnects, duplicate subscriptions accumulate. After a few navigation cycles, the application is maintaining five or six WebSocket connections to the same endpoint, receiving duplicate data, and saturating the browser's network resources.
Fixing these problems after the fact is expensive. Retrofitting OnPush change detection into a 200-component application requires touching every component. Adding virtualisation to a table that was built to render all rows at once requires architectural surgery. These are the problems that enterprise dashboard engineering solves at the point of design, not after a degraded experience has already been delivered to users.
Building a production-grade enterprise dashboard is not primarily a visual design exercise. The visual layer matters, but it sits on top of a set of engineering decisions that determine whether the dashboard will perform acceptably with real data volumes at real update frequencies. These are the decisions we make before writing a single UI component.
The first question for any enterprise dashboard is not "how should this look?" but "how does data reach the UI, and what happens when it does?" For real-time dashboards, this means designing the WebSocket connection layer as a first-class concern. We implement WebSocket subjects using RxJS's built-in webSocket factory, which gives us a cold observable that automatically handles serialisation and deserialisation. Reconnection logic uses exponential back-off with jitter to avoid thundering-herd reconnection storms after a server restart. Connection state is exposed as an observable enum — connecting, connected, disconnected, error — so the UI can render appropriate state indicators without polling.
Client-side buffering is implemented where update frequency exceeds meaningful render frequency. If your backend emits 500 position updates per second, rendering each one individually provides no value to the user — the human eye cannot process 500 frames per second. We buffer incoming events and flush them at 30–60Hz using animationFrameScheduler, delivering smooth, coherent updates without data loss and without unnecessary CPU usage.
Every component in a production enterprise dashboard must explicitly opt into its change detection strategy. We apply ChangeDetectionStrategy.OnPush universally — not selectively — which means the Angular runtime only checks a component for changes when its input references change, an event originates within it, or an async pipe emits. Combined with NgRx memoised selectors using createSelector, the store layer ensures that derived data only re-emits when its source data meaningfully changes. The result is a component tree that does the minimum work possible on every frame.
For high-density data views, we use six specific rendering techniques:
*ngFor directive in a data view uses a trackBy function that returns a stable entity identifier, preventing Angular from destroying and recreating DOM nodes on array reference changes.Enterprise dashboards serve multiple user roles simultaneously — operations managers, analysts, read-only auditors, super-admins — and each role sees a different subset of the interface. Implementing this correctly requires RBAC to be a structural concern, not a conditional CSS concern. Hiding elements with display:none provides no meaningful access control; the data is still fetched, the component is still initialised, and a determined user can reveal it via browser tooling.
We implement permission-based UI access through a structural directive (*appHasPermission) that receives a permission key string, injects the permission service, and conditionally includes or excludes the element from the DOM. Elements excluded from the DOM are never rendered, never initialised, and their data fetching logic is never executed. Route-level guards provide the same gating at the navigation level, with 403 handling that renders an appropriate access-denied state rather than redirecting users unexpectedly. Permission data is loaded from the server at authentication time and stored in the NgRx store, making it consistently available across the application without repeated API calls.
RxJS WebSocket subjects form the foundation of our real-time data architecture. The webSocket factory from rxjs/webSocket produces a subject that behaves as both an observable (incoming messages) and an observer (outgoing messages), making bidirectional communication natural within an RxJS pipeline. We wrap this in a service that exposes typed message streams, handles authentication handshakes, and implements heartbeat/ping-pong protocols to detect stale connections that the browser has not yet detected as closed.
Auto-reconnect logic uses RxJS's retryWhen (or retry with delay in RxJS 7+) with an exponential back-off strategy: the first reconnection attempt fires after 1 second, subsequent attempts double the delay up to a maximum of 30 seconds, with randomised jitter to prevent all clients reconnecting simultaneously after a server restart. NgRx entity adapters handle incoming data normalisation, ensuring that the store maintains a consistent, deduplicated map of entities regardless of the order or frequency of incoming updates.
We select technology based on the specific requirements of each dashboard engagement, but our core stack for enterprise dashboard development has been validated across multiple high-volume, high-complexity production deployments.
Is your existing dashboard slow? We'll identify the root causes — change detection overhead, missing virtualisation, WebSocket mismanagement — and give you a prioritised remediation plan.
Request AuditRelated Services
Configurable KPI card systems with sparkline trends, comparison period deltas, threshold-based colour states, and drill-down navigation. Built to render consistently at any data update frequency.
Grids that handle hundreds of thousands of rows without DOM bloat. CDK virtual scrolling, server-side filtering and sorting, inline editing with optimistic updates, and bulk action support.
WebSocket and SSE integrations with robust reconnection logic, connection state indicators, client-side buffering, and update throttling for consistent 60fps rendering.
Structural directive-based permission systems that exclude restricted UI from the DOM entirely. Server-provided permission matrices with zero code changes required when permissions evolve.
D3.js-powered custom charts for complex data relationships, heatmaps, time-series with brush selection, and multi-dimensional scatter plots — built as reusable Angular components.
Multi-dimensional filter systems with persisted URL state, saved filter views, faceted search with count indicators, and full-text search with highlight matching.
The combination of CDK Virtual Scrolling and WebSocket buffering is the foundation. CDK Virtual Scrolling ensures that only the rows currently visible in the viewport exist in the DOM, keeping DOM node count constant regardless of dataset size. WebSocket updates are buffered and flushed at the frame rate using animationFrameScheduler, so the UI receives coherent batches of updates rather than attempting to re-render on every incoming message. For sorting and filtering, we offload the computation to a Web Worker so the main thread is never blocked. The result is that dataset size has a negligible effect on interaction latency — a grid with 10,000 rows scrolls and filters as responsively as one with 100 rows.
Yes. We implement connection state management as a first-class concern, with the UI surfacing connectivity status clearly — not hiding it with spinner overlays. Data that was loaded before connectivity was lost remains visible and is clearly marked as potentially stale. Where appropriate, we implement a Service Worker caching layer for static assets and recent data snapshots, enabling basic dashboard functionality during brief connectivity interruptions. WebSocket reconnection with exponential back-off handles the automatic restoration of real-time feeds when connectivity returns. For applications that require full offline capability, we can integrate IndexedDB persistence with a sync-on-reconnect strategy.
We treat permission-based UI as a structural question, not a visual one. The information architecture of the dashboard — what panels exist, what navigation items appear, what actions are available — is driven by the server-provided permission matrix for the authenticated user. Users should not see controls they cannot use; they should not encounter 403 errors mid-workflow. We design role-specific views as explicit variants of the dashboard, validated with each user role in the design phase, so the experience for a read-only auditor and the experience for a super-admin are both coherent and intentional rather than being one view with elements removed.
Generic dashboard templates are built for demonstration with small, static datasets. They use Default change detection because it is simpler. They render all rows to the DOM because virtualisation requires additional setup. They use polling rather than WebSocket because it is easier to implement. They style themselves for visual impact in screenshots rather than readability at high information density. Our builds start from the data requirements: actual update frequency, actual row counts, actual user roles, actual interaction patterns. The architecture is chosen to meet those requirements, and every technical decision is documented so your engineering team understands why it was made.
It depends on the use case, and we will give you an honest assessment. Many enterprise dashboards exist in contexts where mobile use is genuinely rare — operations staff sit at workstations with large monitors, and the information density of the dashboard is incompatible with a 375px viewport. In those cases, a fully functional desktop experience with a graceful degradation message on mobile is the right engineering decision. Where mobile access genuinely matters — field supervisors accessing status views on tablets, management reviewing KPIs on phones — we design a purpose-built mobile view that surfaces the most critical data rather than attempting to compress the full desktop dashboard.
Share your requirements and we'll respond with a direct technical assessment — not a template proposal.